Managing multiple jobs and feeling the chaos? See a simpler way to stay in control—without bloated enterprise software.
Get a personalized demo →
Your projects aren’t static entities. Things happen over time. That's why it’s important to be able to show important dates and events visually on a timeline so others can see the full picture of your project.
In this guide, you’ll learn how to make a simple timeline in Word, PowerPoint, and Excel, with free downloadable templates to help you get started faster.
A project timeline is a chronological graph of activities and milestones scheduled in your project plan. You might break your timeline down by day, week, month, quarter, or even year, depending on the project’s scope of work and level of detail you need to share.
In project management, timelines provide a simple way to communicate important deadlines and deliverables to your teams and stakeholders.
Let’s take a look at 2 common types of timelines, with examples of how you might use them in project management.
Linear timelines are often found in history books, but their simplicity comes in handy for project managers too.
A linear timeline plots a series of dates and events in sequential order along a single horizontal or vertical line. This type of timeline is perfect for communicating high-level project information and status.
Here’s an example of how you might use this type of timeline to give executive leaders a broad overview of project work without overloading them with too many details.

A gantt chart is packed with details about the whole project—things like dependencies, resource assignments, task discussions, and important project files.
A gantt chart is versatile enough to communicate whatever level of detail you want to show in your timeline—whether you’re outlining your annual project roadmap or scheduling day-to-day tasks for a digital marketing campaign.
Here’s a simple example of a gantt chart timeline for building a treehouse, with resource assignments and task dependencies noted.
If you're looking for an easy tool, we recommend TeamGantt's gantt chart maker.

Timeline planning is an important part of any project management process. Let’s walk through 4 simple steps you can follow when creating a timeline for your projects.
Different timeline styles serve different purposes, so choose the format that aligns best with your overall goal and target audience.
For example, let’s say you need to communicate who’s responsible for what and when to your team. In that case, a gantt chart is your best bet. That’s because it allows you to assign specific deadlines and resources to the work and connect related tasks with dependencies.
If you simply need to give managers or stakeholders a 10,000-foot view of the project, a linear timeline will do. Go vertical with your timeline if you plan to share or print it in portrait orientation. Presenting your timeline on screen in a meeting? Horizontal timelines make the best use of space in a slide deck.
Breaking your project down into phases, tasks, and key milestones is a good practice to get into whether you use a timeline or not. Considering the steps in your project as part of a hierarchy can help you stay organized and determine task priorities.
Let’s use a construction project as an example. You might include these first few steps on your timeline:
Of course, that’s just the beginning, and there are many smaller steps that make up each of those phases. A work breakdown structure is a great tool for scoping out all the granular details. For a basic timeline, however, keeping it simple will suffice.
Now that you’ve broken your project down into manageable chunks, it’s time to determine how long each timeline event will take and when major deliverables are due. If you’ve done similar projects in the past, reviewing those timelines is a good place to start.
Conversations are your best friend at this stage of timeline planning. Get input from the people who will actually be doing the work to be sure your estimates are on point. And don’t be afraid to ask stakeholders for more information along the way if you can’t find an answer in the scope document.
Finally, take your list of project activities, and add them to your timeline in the order work needs to happen. Don’t forget to clearly label the start and end dates of your project.
If you’re making a linear timeline, you might want to set your intervals by week or month, depending on the length of the project.
A gantt chart makes it easy to zoom in at a daily or weekly level if you’re building a timeline for your project team. Be sure to add dependencies between related tasks that need to happen in sequential order.
Easy drag and drop features with templates for faster scheduling. Plan a project in minutes, collaborate easily as a team, and switch to calendar and list views in a single click.
Create your free plan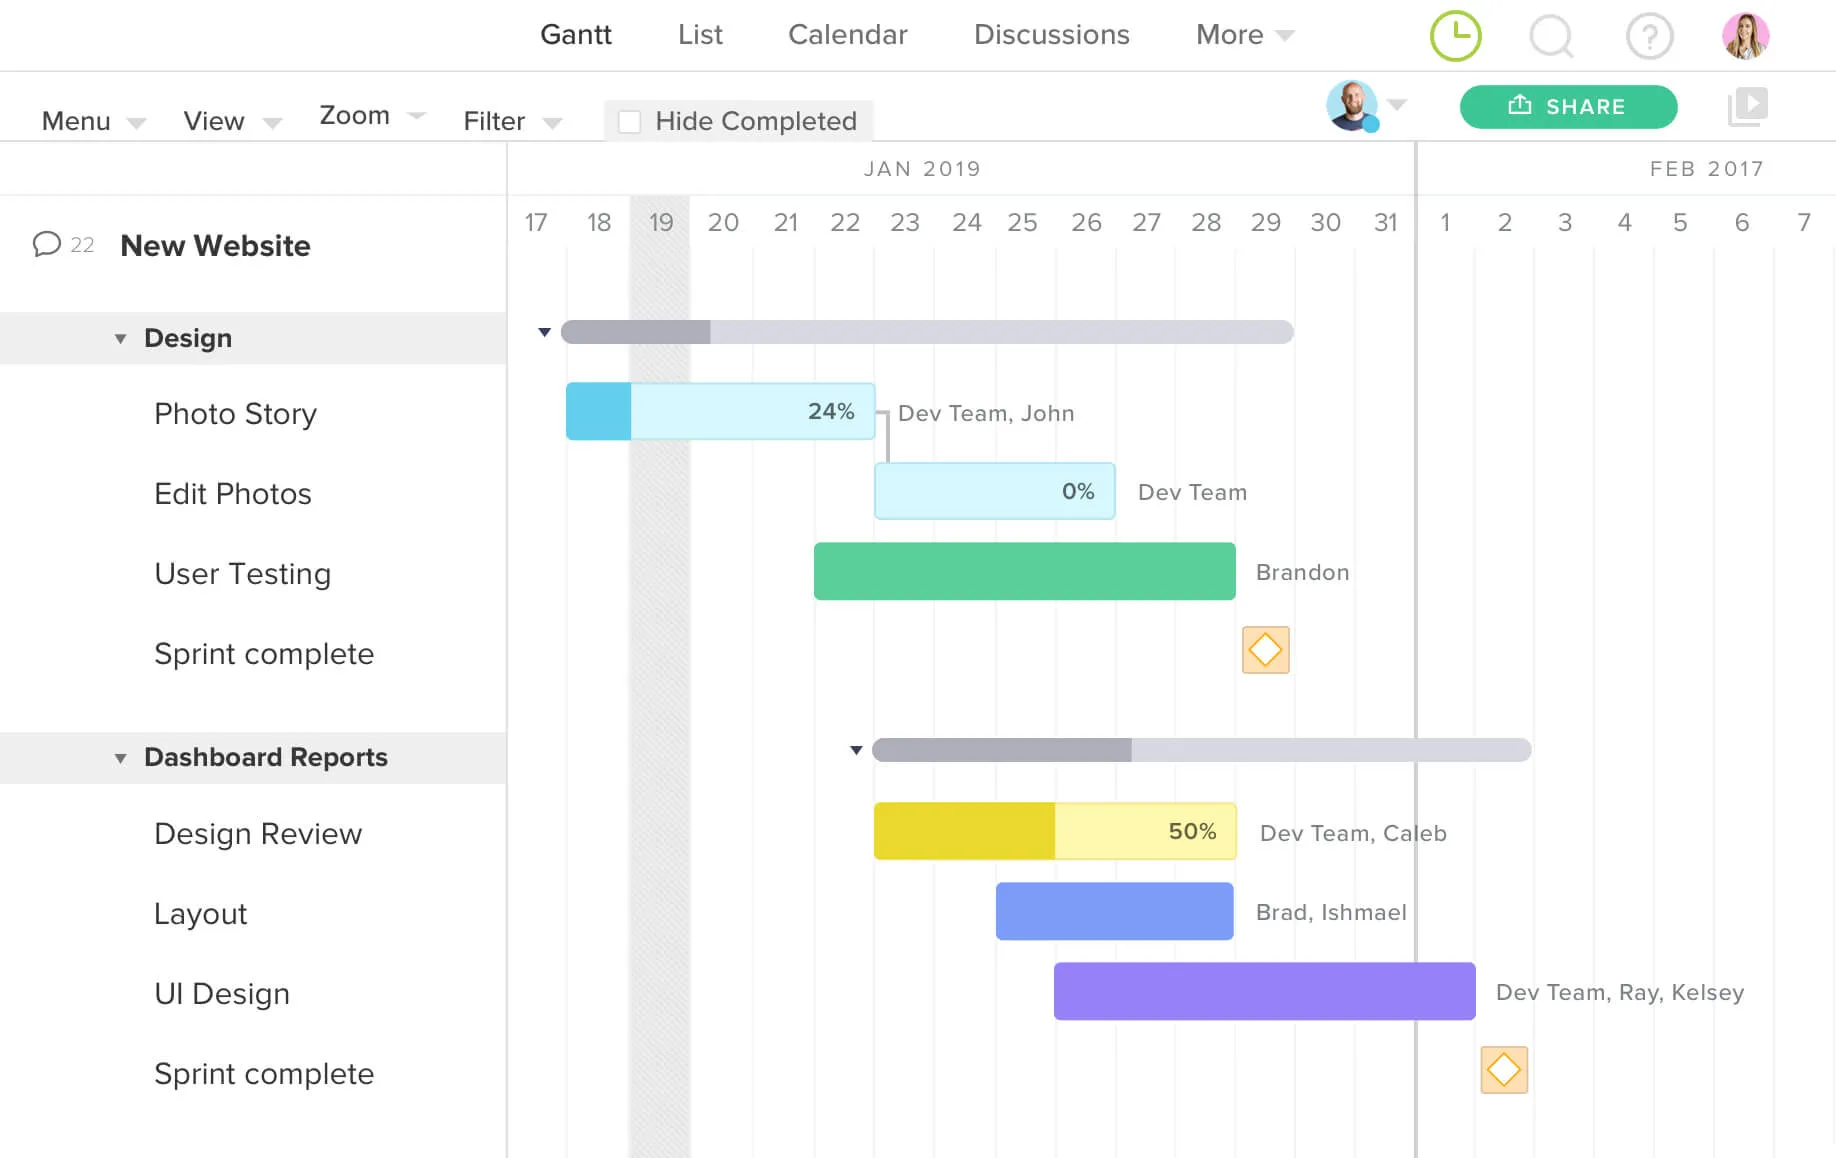
Luckily, creating a timeline for your project is a pretty easy task once you know where to look. And the process is basically the same whether you choose to use Microsoft Word, PowerPoint, or Excel to do it.
While none of these applications are the most flexible solution for managing projects, they can be helpful for sharing project timelines with executive leaders or other key stakeholders, as well as creating client presentations.
Which application you choose to create your timeline is completely up to you. There are no real benefits of one over the other as far as the timeline itself is concerned. The best option is to choose the application either you're most comfortable with or that's most commonly used by your team and project stakeholders.
Follow these basic steps to create a project timeline in PowerPoint, Word, or Excel.
If you already have a presentation, document, or workbook you want to insert a timeline into, open your existing file.
Starting from scratch? Create a new presentation, document, or workbook by opening the program and clicking on File > New. Here’s an example of how this step looks in PowerPoint:

Next, decide where you want the timeline to go in your document. Then click Insert > SmartArt, and choose a timeline style from the Process menu. Select any design you like—it can be changed easily later.
Here’s what this step looks like if you build your timeline in Microsoft Excel:

Now that your timeline has been created, it’s time to add your project events to it.
Remember, this timeline is for the main phases and high-level events. You don’t need too much detail here. The event, event date, and event status are probably plenty, but every project is different.
The timeline comes preloaded with a few placeholder events. Simply click on [Text] in the first placeholder event, and rename it to match your first project activity. Repeat the process for the remaining 2 default entries.
Once you’ve edited your final default entry, just hit Enter or click + to add a new project activity. Continue this step until all your main project events have been added to your timeline.
Here’s a sample project timeline we created in Microsoft Word:

There are many different styles of timelines available to you. They all function the same, but some may be easier to read than others, depending on the amount of data in your timeline.
To change timeline styles, highlight your timeline, and choose new a new design from the Smart Art>Process menu. The design will update, and your data will stay intact.
Want a head start creating your project timeline? Download one—or all—of our free templates to save time on setup.
Want to create a more detailed timeline with resource assignments? See our Excel gantt chart template or try one of our online gantt chart templates.
When you’re a project manager, every minute counts. So why waste time building out a bunch of complicated spreadsheets just to keep tabs on a project?
At TeamGantt, you don’t have to. Our free online timeline maker enables you to stay focused on the tasks that move the needle. Whip up a project timeline in minutes, and watch your team cross the finish line faster. It really is that simple.
Easy drag and drop features with templates for faster scheduling. Plan a project in minutes, collaborate easily as a team, and switch to calendar and list views in a single click.
Create your free plan