Our easy premade Excel gantt chart template can save you tons of time by organizing your project plan and tackling the tedious scheduling work for you!
Use this Excel gantt chart to simplify complex projects into an easy-to-follow plan and track the status of tasks as work progresses. This free template is also useful for keeping track of project deadlines, milestones, and hours worked. Learn more about gantt charts.
Before you get started, check out this quick Excel vs. TeamGantt comparison to see how you can save time and effort managing gantt charts in TeamGantt.
We made this Excel gantt chart template easy, powerful, and painless to use for projects of any kind—from construction projects to website redesigns and beyond. It’s great for scheduling simple projects that don’t require real-time collaboration.
TeamGantt’s free Excel gantt chart template enables you to:
You can customize our Excel template to view and manage projects over any time period, whether it’s weekly, monthly, or quarterly. Simply plug in your tasks, dates, and resources, and you'll have a presentation-quality Excel gantt chart. Be sure to update the percent complete as work progresses to stay on top of project tracking.
Want to learn how? First, download the Excel gantt chart template, then watch our Excel gantt chart template tutorial on YouTube below.

If you want to spend less time building spreadsheets, check out some of our other Excel project management templates. Here are a few you can download for free:

Want to learn how to build an Excel gantt chart from scratch? This step-by-step tutorial guides you through how to do an Excel gantt chart that maps out dates on your project timeline.
Note: We performed the following steps in Microsoft Excel 365 for Mac, but the basic workflow should be the same on a PC or in any version of Excel with minor changes.
Create columns for Task Name, Start Date, End Date, and Duration, and fill those cells with the basic details for your project tasks.
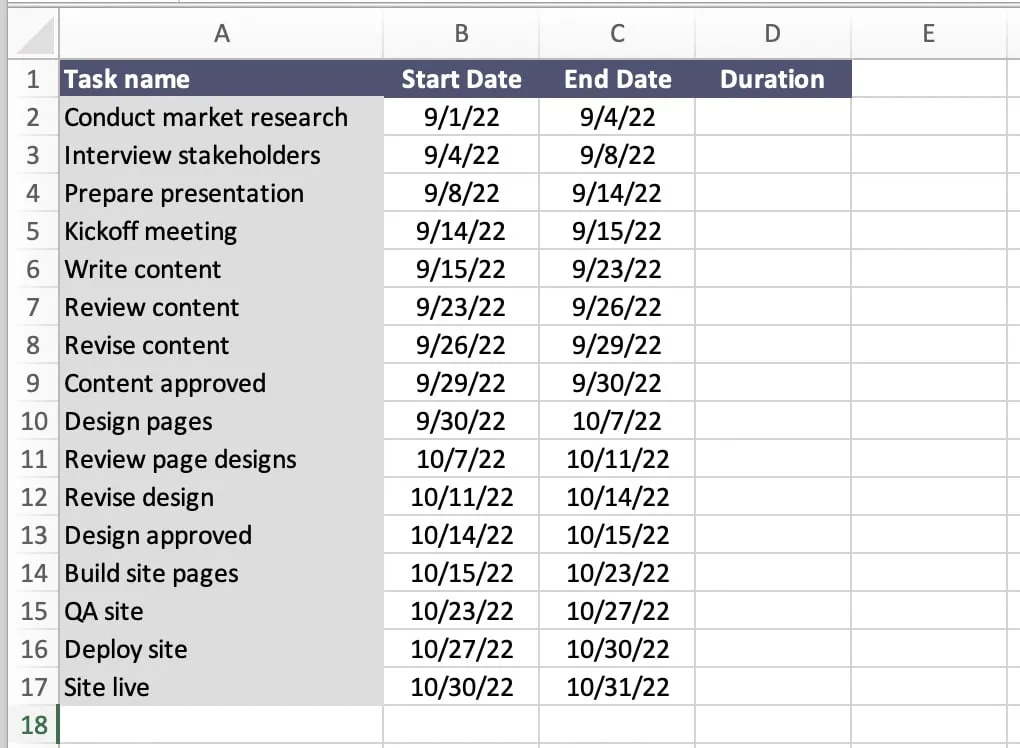
Format these columns as follows:
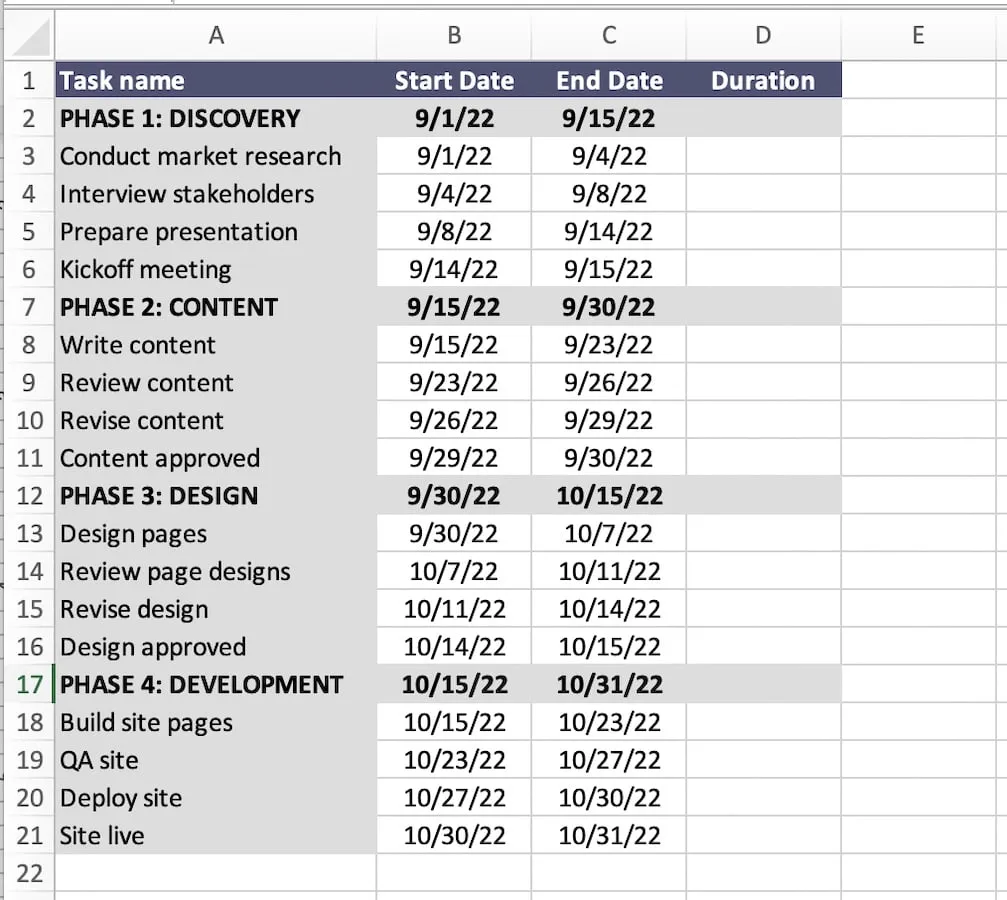
Want to organize your Excel gantt chart into phases with subtasks? Add a row before the first task in each project phase, and enter the following dates for each task group:
Use a simple formula to subtract the start date from the end date. That way your Excel worksheet will automatically calculate the length of each task in your gantt chart. For instance, we entered =C2-B2 into the Duration field for our first task.
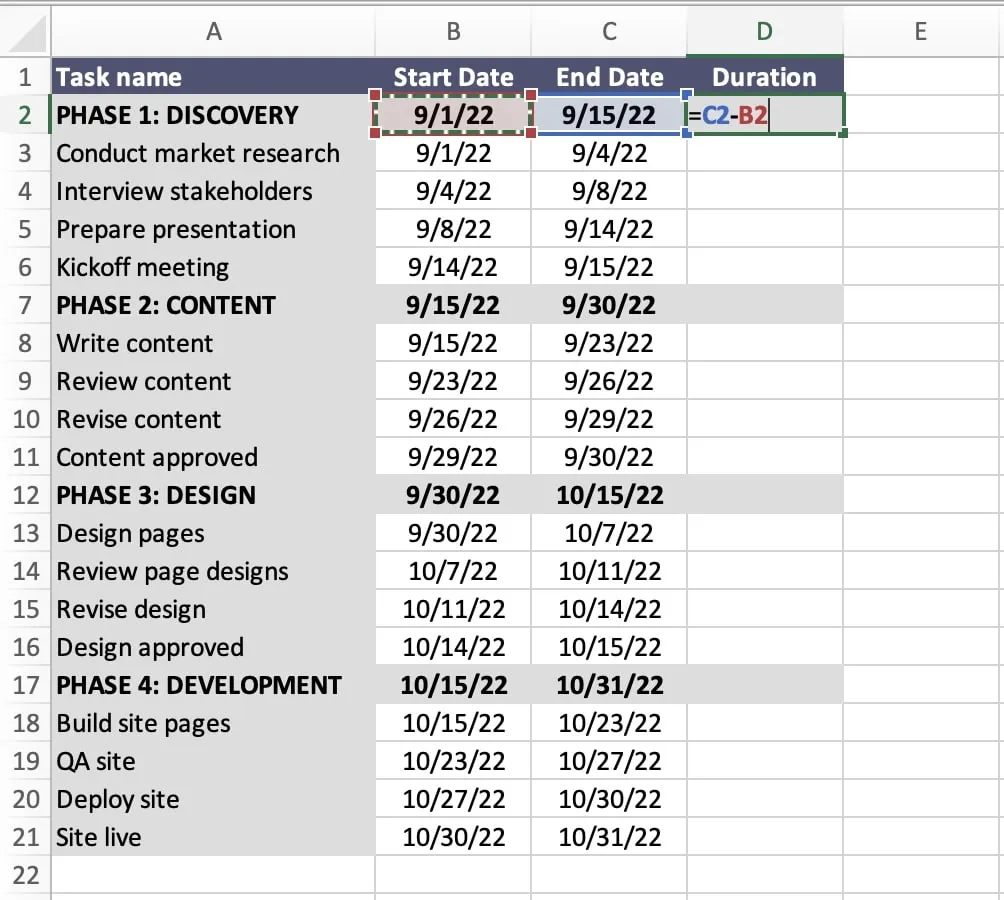
Tip: If you started in different cells in your worksheet, be sure to adjust this formula accordingly.
Place your mouse on the right corner of D2 until you see a black + sign and double-click or drag your mouse down to paste the formula in the remaining cells in column D.

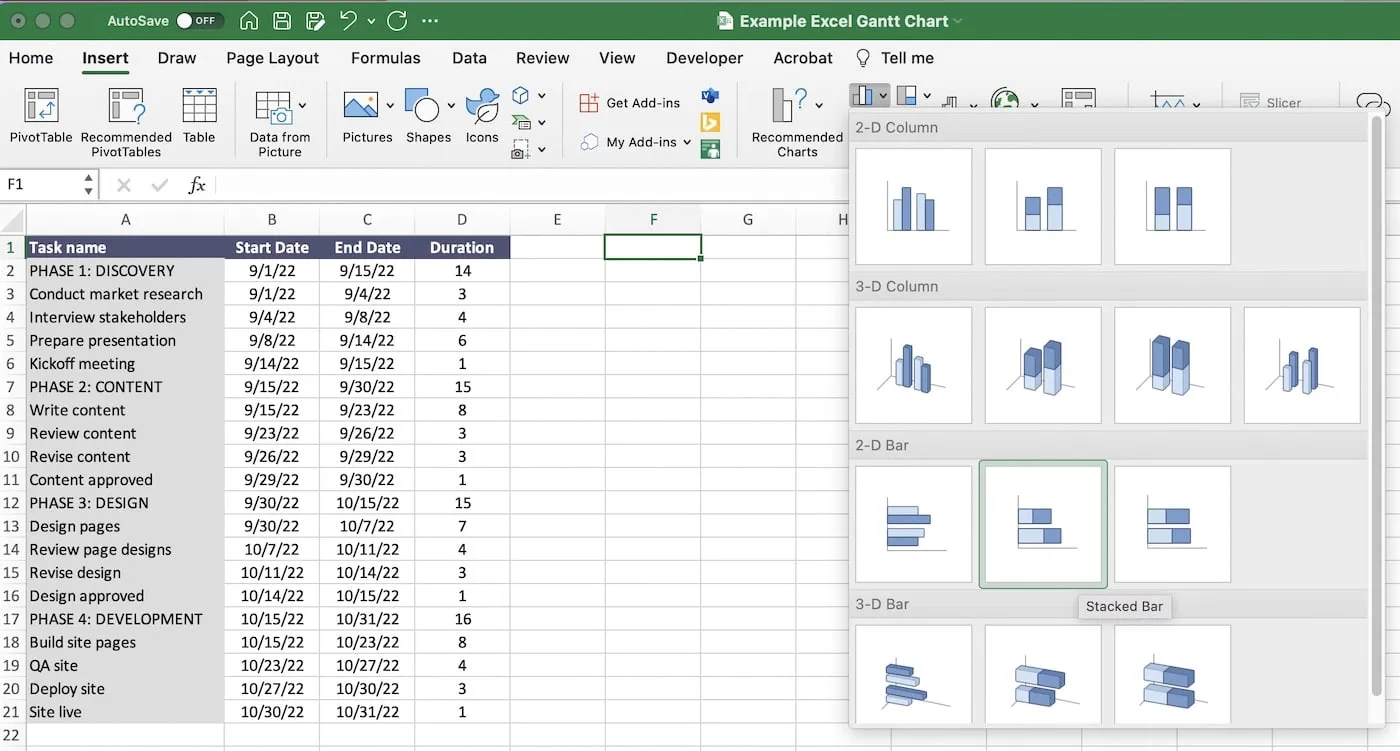
Click the Insert tab, and select the bar chart icon.
Choose Stacked Bar from the 2-D Bar section to add a chart to your Excel worksheet. This chart type most closely resembles a gantt chart.
You should see a blank chart in your Excel worksheet now. Right-click the chart, and choose Select Data.

Click the plus sign (+) under the Legend entries section to add the first data set. Name it "Start Date." Then click on the Y values field, and select the data in the Start Date column.
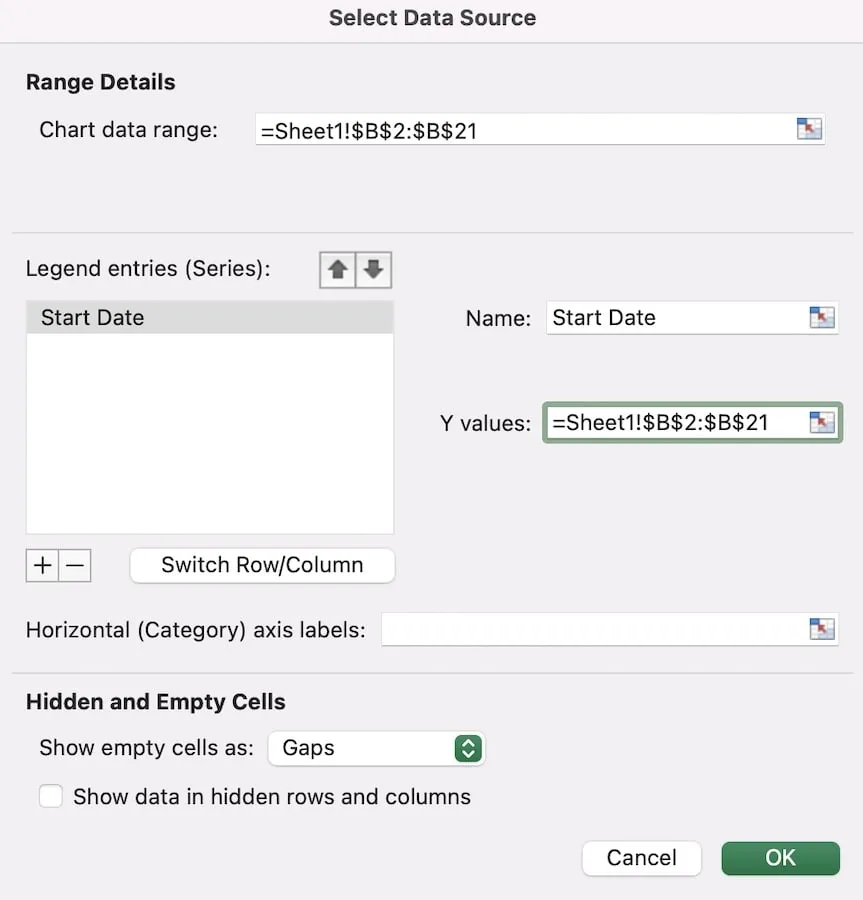
Repeat this process to add a second entry called “Duration,” making sure to select the data in the Duration column for the Y values. Click the Horizontal Axis Labels field, and select the entire Task Name column.

Tip: Make sure the Show data in hidden rows and columns checkbox is ticked so your Excel gantt chart will still work if you decide to hide any of the columns or rows in the worksheet.
Double-click the Chart Title textbox to select the full title.
Enter the name of your project to replace the generic placeholder text.

Copy the Start Date for the first task in your project into a blank cell below your task list, and format that cell as a number rather than a date. Repeat this process for the End Date for the last task in your project.

Tip: Excel stores dates as numbers. In our gantt chart example, Excel converts the Start Date for our first task from 9/1/22 to 44805.00, while the End Date for our last task becomes 44865.00 instead of 10/31/22.
Now select the horizontal axis of your gantt chart, right-click, and choose Format Axis.
Under Bounds, there are fields for Minimum and Maximum. These are the first and last “dates” in the chart.
Change the Minimum value to the number you got when you converted the first task date into a number and the Maximum value to the number for your last task date.

Hit Enter to remove the extra time from the beginning of your chart.
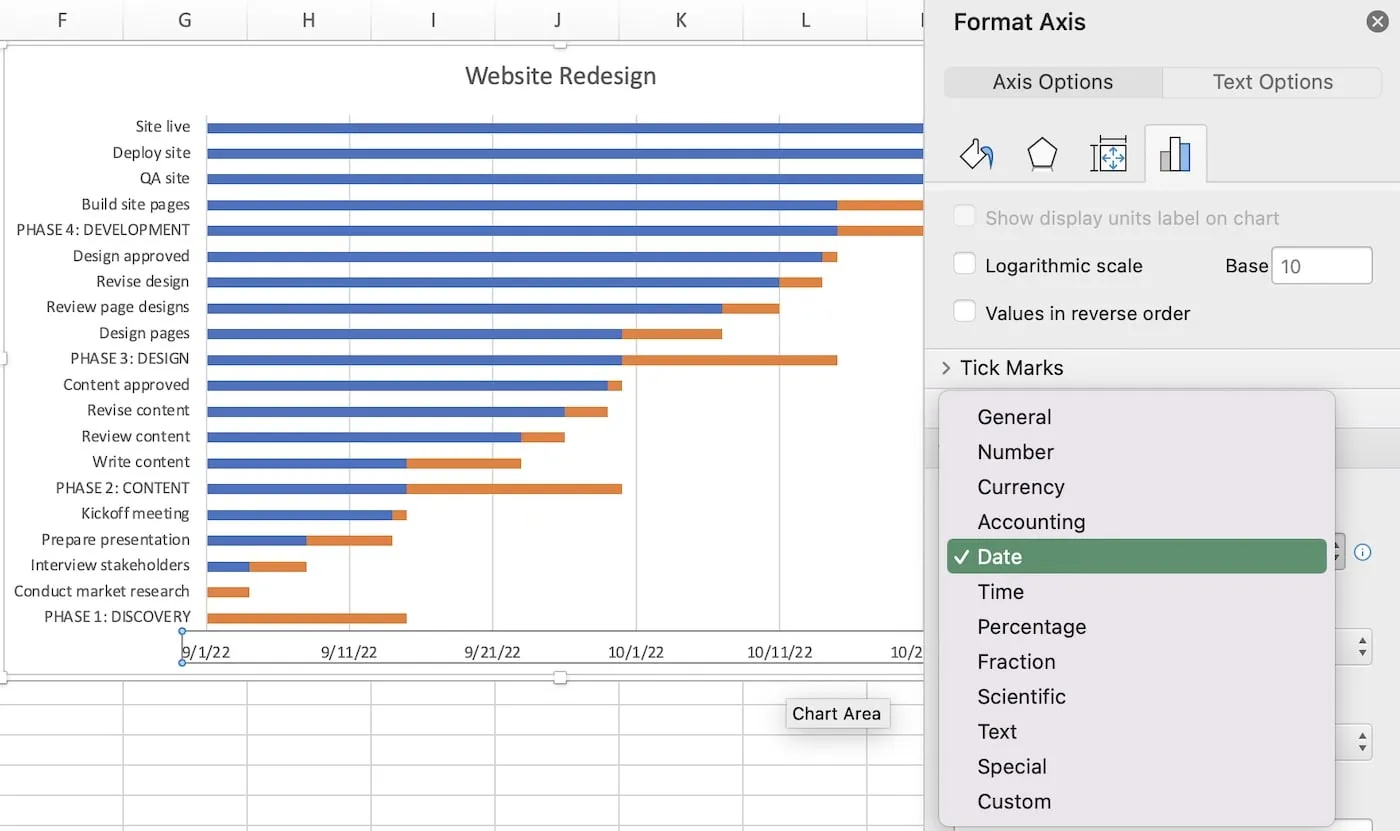
If the labels on the horizontal axis of your gantt chart show numbers instead of dates, click the Number section of the Format Axis window to expand it.
Change the category from Number to Date. Now the horizontal axis will show readable dates.
Under Units in the Axis Options section, you’ll find Major and Minor fields. These determine the timeline intervals for your Excel gantt chart.
Enter 7.0 into the Major field to set the project timeline in your Excel gantt chart at weekly intervals.

Tip: Want a monthly gantt chart? Set the Major field at 30.0 for monthly intervals.
Select the vertical axis, right-click, and choose Format Axis.

Tick the Categories in reverse order checkbox.

This also moves the date axis to the top of the chart where it’s a little more useful.
Click on the first portion of a taskbar with 2 colors to select all of the bars in your first data series. In the Excel chart below, our first data series is represented by the blue taskbars.

Then click the Paint Bucket tab, and expand the Fill section.
Select No fill to remove the blue bars that precede your task start dates.

Click on a single bar twice. Don’t double-click it—click it once to highlight all the bars in that color, then click it again to highlight a single bar.
Click the Paint Bucket icon, and choose the color you want from the color fill options.

Tip: Differentiate project phases from subtasks by giving phase taskbars a neutral color, such as gray.

Tip: Color milestones yellow or gold in your gantt chart so they stand out easily from other tasks.

Repeat this process for the rest of the bars in your newly made gantt chart to change their colors.

Congratulations! You’ve created your very own weekly gantt chart in Excel. That was probably a few more steps than you bargained for. Especially if you have to do that every time you need to create a gantt chart for a new project. That’s where TeamGantt comes in.
Gantt charts that are simple, beautiful, and super-easy to manage and update is exactly what TeamGantt was designed from the ground up to do.
Forget having to keep track of multiple Excel gantt chart files for each project and wasting time making sure all your charts are presentation-ready. TeamGantt makes it easy—and dare we say FUN—to create and manage your projects with shareable online gantt charts.
Here’s a quick peek at how you can save time and headaches making gantt charts and managing projects with TeamGantt compared to Excel:
| Excel | TeamGantt | |
|---|---|---|
| Presentation-quality gantt charts |  | |
| Compatible with Mac & Windows | | |
| Drag & drop scheduling |  | |
| Calendar, task list, & kanban board views | | |
| Track & collaborate on tasks in real time | | |
| Upload important project files | | |
| Share view-only links | | |
| Keep tasks in order with dependencies | | |
| Compare planned vs. actual timelines | | |
| See team availability | | |
| Track hours worked | | |
No need to build your plan from scratch with TeamGantt’s collaborative gantt chart template! We’ve plugged in some basic project elements for you. Feel free to duplicate task groups to speed up your gantt chart setup.
Try our basic project gantt chart template! Or browse our full library of free collaborative gantt chart templates.
Ready to get started? Follow these easy steps to set up your first project in TeamGantt.

1. Go to teamgantt.com/signup to sign up for your free account to get started.
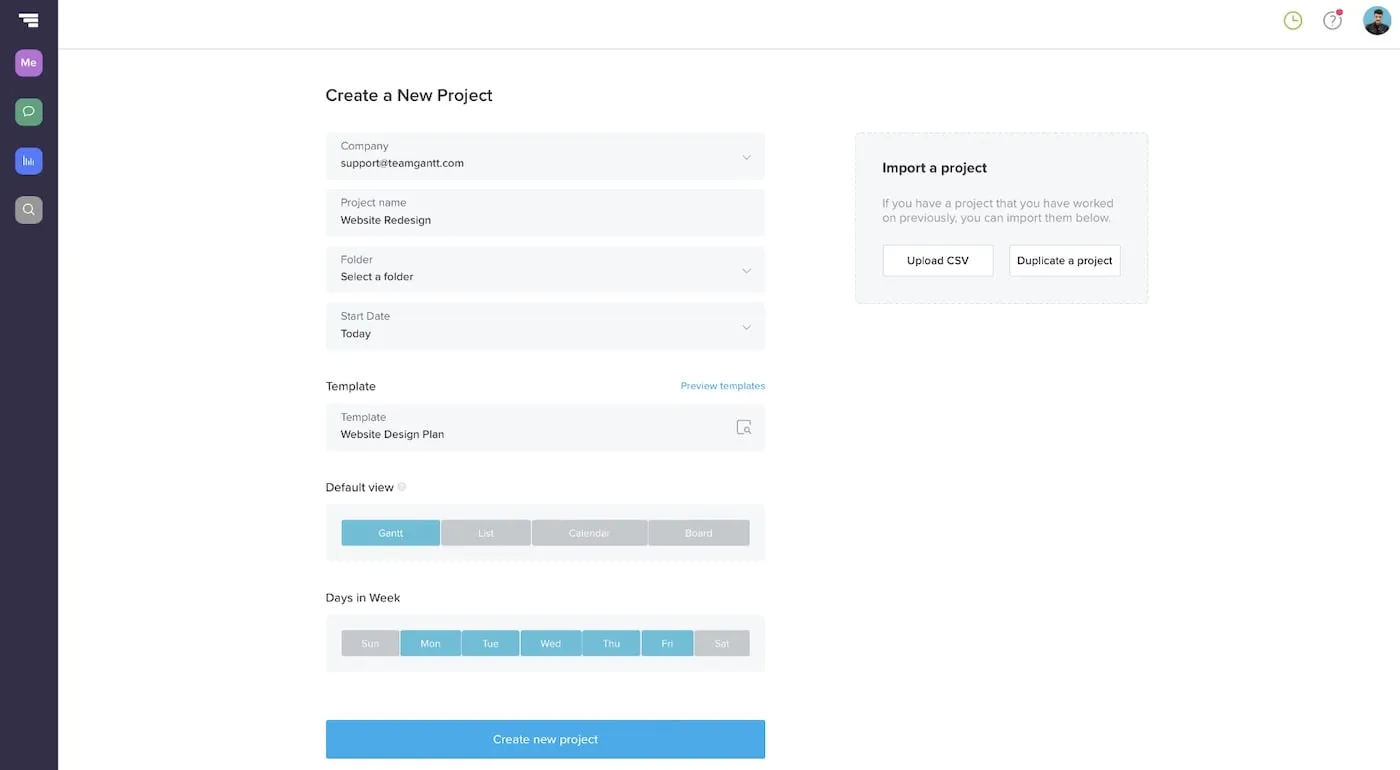
2. Once you log in, go to My Projects in the sidebar, and click + New Project, then Create New Project.
3. Give your project a name, and choose a project template to get you started if you want. Choose your default project view and the days of the week you want to be able to schedule work in your project. Then click Create New Project.
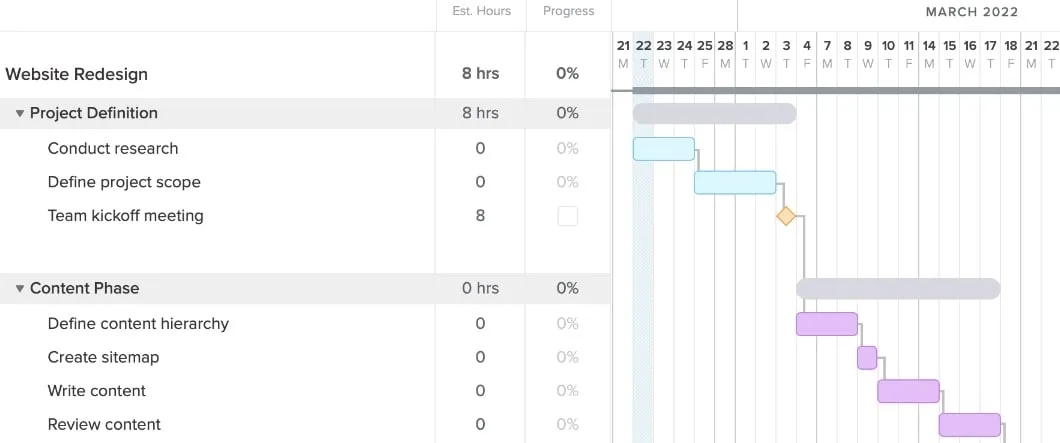
4. Your project is created, and you’re ready to start adding your tasks!
5. Once you’ve added your tasks to the task list, just click and drag each taskbar to set the dates and duration.

6. If you have tasks that can’t begin until another task is complete, you can add a dependency to your gantt chart to make sure those tasks are always done in the proper order. Simply click the gray dot to the right of the first task, and drag the dependency to the dependent task.
You’re all done! Congratulations on creating your first project in TeamGantt!
In TeamGantt, you can create unlimited gantt chart templates from the projects you build. Here are 2 easy ways to save a project as a template from Gantt view:
Your gantt chart template evolves with your root project so it stays up-to-date.
Using a template to create a new project is as easy as clicking the Template dropdown on the project creation screen and choosing the one you want to use from the template library. No more starting from a blank screen!

Any gantt chart templates you save will be listed under the My Templates section. Once your gantt chart template loads, simply update the tasks and invite your team.
You can create a beautiful project plan in just minutes with TeamGantt. And because everything happens online, it's easy to track project progress and collaborate with your team in real time.
Sign up for your free account today!
Unfortunately, Excel doesn’t come with a built-in gantt chart template. You’ll need to create a gantt chart manually in Excel, then save it as a template for future project use.
You can save any Excel file you make as a template. Simply follow these steps to build a gantt chart of your own in Excel. Then click File >Save as template to create an Excel gantt chart template you can use again and again to schedule project timelines.
To format your Excel gantt chart by week, right-click on the date axis, and select Format Axis. Expand the Axis Options section, and enter 7.0 into the Major field below Units for weekly intervals.
To format your Excel gantt chart by month, right-click on the date axis, and select Format Axis. Expand the Axis Options section, and enter 30.0 into the Major field below Units for monthly intervals.
It won’t be a perfect monthly picture since some months have more or less days, but it should provide a decent visual approximation for your Excel gantt chart.
Start by downloading our free gantt chart Excel template, which has progress bars built-in. Then all you have to do is update progress in the Percent Complete column, and Excel will adjust the taskbar on the gantt chart to reflect the current status.